Here, We provide Internetwork Security and Web Analytics GTU Paper Solution Winter 2022. Read the Full ISWA GTU paper solution given below.
Internetwork Security and Web Analytics GTU Old Paper Winter 2022 [Marks : 70] : Click Here
(a) What is web Menace? Explain.
“Web Menace” is not a commonly used term, and it’s unclear what exactly it refers to. However, there are several types of online threats that could be considered a menace to users on the web. Here are a few examples:
- Malware: Malware is short for “malicious software,” and it refers to any software designed to harm a computer system or steal data. Malware can be delivered through malicious websites, email attachments, or downloads from untrustworthy sources.
- Phishing: Phishing is a type of social engineering attack where scammers impersonate a trusted source (such as a bank or a social media platform) in order to trick people into giving up sensitive information like passwords or credit card numbers.
- Cyberbullying: Cyberbullying is the use of technology to harass, embarrass, or threaten someone. This can take many forms, including spreading rumors online, posting embarrassing photos, or sending threatening messages.
- Online scams: Online scams are schemes designed to trick people into giving away money or personal information. These can take many forms, such as fake job offers, lottery scams, or romance scams.
- Hate speech and misinformation: While not necessarily a direct threat to individuals, hate speech and misinformation can create a toxic online environment that can lead to real-world harm. Hate speech can contribute to the spread of prejudice and discrimination, while misinformation can lead people to make bad decisions or take dangerous actions.
(b) Give the difference between host based security and
Perimeter security.
Host-based security and perimeter security are two different approaches to protecting computer systems and networks from cyber threats. The main difference between them lies in where they focus their efforts.
Host-based security focuses on securing individual computer systems or hosts (such as servers, laptops, or desktops). This approach involves installing security software on each host to monitor and control access to resources, detect and respond to security events, and enforce security policies. Host-based security measures include things like antivirus software, firewalls, intrusion detection systems, and access control mechanisms. The idea is to protect the individual hosts from attacks that originate both from within and outside the network.
Perimeter security, on the other hand, is focused on securing the boundary or perimeter of the network. This approach involves deploying security measures such as firewalls, intrusion prevention systems, and virtual private networks (VPNs) at the network perimeter to prevent unauthorized access to the network and protect against external threats. Perimeter security measures are intended to stop threats before they reach the internal network.
(c) Explain different classes of attacks
In internetwork security, there are several different classes of attacks that malicious actors can use to compromise the security of a network. Here are some of the most common:
- Denial-of-Service (DoS) attacks: This type of attack is designed to overwhelm a network or system with traffic or requests, making it unavailable to legitimate users. DoS attacks can be accomplished using various methods such as flooding the network with traffic, sending malformed packets, or exploiting vulnerabilities in network devices.
- Man-in-the-middle (MitM) attacks: MitM attacks involve intercepting communication between two parties and tampering with it. An attacker can use this technique to eavesdrop on sensitive data, modify messages, or inject their own malicious content into the communication.
- Password attacks: Password attacks involve attempting to guess or crack a user’s password. These attacks can be accomplished using techniques such as brute force, dictionary attacks, or social engineering.
- Malware attacks: Malware refers to any software designed to harm a computer system or steal data. Malware attacks can take many forms, such as viruses, worms, trojans, or ransomware.
- Phishing attacks: Phishing attacks are a type of social engineering attack where an attacker sends a fraudulent message (such as an email or a website) that appears to be from a trusted source in order to trick the user into giving up sensitive information.
- SQL injection attacks: SQL injection attacks involve inserting malicious code into a website or application’s database queries in order to extract or modify sensitive data.
- Cross-site scripting (XSS) attacks: XSS attacks involve injecting malicious code into a website in order to steal data or take control of a user’s session.
- Buffer overflow attacks: Buffer overflow attacks involve exploiting a vulnerability in software or hardware that allows an attacker to overwrite memory and execute arbitrary code.
(a) Explain the types of web analytics.
Web analytics is the process of collecting, analyzing, and reporting on data related to a website’s usage and performance. There are several different types of web analytics, each of which provides different insights into how users interact with a website. Here are the most common types of web analytics:
- Traffic Analytics: Traffic analytics is the most basic type of web analytics and focuses on measuring the volume of traffic to a website. It provides information about the number of visitors, page views, and other basic metrics that can help website owners understand how much traffic their website is getting.
- Audience Analytics: Audience analytics focuses on understanding the characteristics of website visitors, such as their demographics, interests, and behaviors. This type of analytics can provide insights into the types of content and messaging that resonate with different audience segments.
- Content Analytics: Content analytics focuses on understanding how users interact with website content, such as which pages are most popular, how long users spend on each page, and which pages have the highest bounce rates. This information can help website owners optimize their content to improve engagement and drive conversions.
- Conversion Analytics: Conversion analytics focuses on understanding how well a website is performing in terms of achieving specific goals, such as filling out a form or making a purchase. This type of analytics can help website owners identify areas for improvement in the conversion process.
- Marketing Analytics: Marketing analytics focuses on understanding the effectiveness of different marketing channels and campaigns in driving traffic and conversions. This type of analytics can help website owners optimize their marketing spend and tactics to achieve better results.
- Real-time Analytics: Real-time analytics provides up-to-the-minute information about website usage and performance. This type of analytics can be useful for monitoring the impact of changes to a website or responding to sudden spikes in traffic or other anomalies.
(b) What is the difference between internal search and external search in
website?
Internal search and external search are two different types of search functionality that can be implemented on a website. Here are the differences between them:
- Internal search: Internal search refers to the search functionality that is provided within a website itself. This means that users can search for content or products within the website using a search bar or other search interface. Internal search is typically used to help users find specific information or products within a website quickly and easily. The search results are generated based on the content of the website itself, and can be customized to provide relevant information to the user.
- External search: External search, on the other hand, refers to the search functionality that is provided outside of a website, typically through search engines like Google or Bing. External search is used by users who are looking for information that is not available on a specific website. The search results are generated based on the relevance of the content to the search query, and may include results from multiple websites.
(c) Explain Data Capturing tools with example.
Data capturing tools are software programs that are designed to help organizations collect, process, and analyze data. There are many different types of data capturing tools available, ranging from simple web analytics tools to complex enterprise-level data management platforms. Here are some examples of data capturing tools:
- Google Analytics: Google Analytics is one of the most popular web analytics tools that helps organizations track website traffic and user behavior. It provides detailed information about the number of visitors, page views, bounce rates, and other key metrics.
- Salesforce: Salesforce is a customer relationship management (CRM) platform that helps organizations manage their sales, marketing, and customer service activities. It captures and stores data related to customer interactions, sales transactions, and marketing campaigns.
- SurveyMonkey: SurveyMonkey is an online survey tool that helps organizations collect feedback and opinions from customers, employees, and other stakeholders. It provides a range of survey templates and data analysis tools to help organizations make informed decisions based on the data collected.
- Qualtrics: Qualtrics is an enterprise-level data management platform that helps organizations capture and analyze customer and employee feedback, market research data, and other types of data. It provides advanced analytics tools and integrations with other data sources to help organizations make data-driven decisions.
- Tableau: Tableau is a data visualization and analytics tool that helps organizations create interactive dashboards and reports from various data sources. It provides a range of visualization options and data analysis tools to help organizations make sense of their data.
(c) Explain the metrics for web analytics.
Web analytics metrics are used to measure the performance and effectiveness of websites. They help website owners and marketers to understand how visitors interact with their website and to identify areas for improvement. Here are some of the most commonly used web analytics metrics:
- Traffic: This metric refers to the number of visitors to a website. It can be broken down into different types of traffic such as organic, paid, direct, or referral.
- Pageviews: This metric refers to the number of times a specific page on a website is viewed by visitors. It is an important metric for understanding which pages are most popular on a website.
- Bounce rate: This metric measures the percentage of visitors who leave a website after only viewing one page. A high bounce rate can indicate that visitors are not finding what they are looking for on the website.
- Time on site: This metric measures how long visitors stay on a website. It can be an indicator of how engaging and valuable the website content is to visitors.
- Conversion rate: This metric measures the percentage of visitors who take a desired action on a website, such as making a purchase, filling out a form, or subscribing to a newsletter.
- Exit rate: This metric measures the percentage of visitors who leave a website from a specific page. It can be an indicator of problems with the page, such as slow loading times or poor design.
- Click-through rate (CTR): This metric measures the percentage of visitors who click on a specific link or call-to-action on a website, such as a button or hyperlink.
- Referral sources: This metric tracks where visitors to a website are coming from, such as search engines, social media platforms, or other websites.
- Engagement: This metric measures how visitors interact with a website, such as through comments, shares, or likes on social media.
- Mobile usage: This metric tracks the number of visitors accessing a website from mobile devices and can be an indicator of the need for mobile optimization.
(a) Explain key performance indicator
A key performance indicator (KPI) is a measurable value used to evaluate the performance of a particular activity, process, or business objective. KPIs are used to help businesses and organizations track progress towards achieving their goals and objectives.
KPIs should be specific, measurable, achievable, relevant, and time-bound. This means that they should be defined in a way that makes them easy to measure and track, and they should be directly tied to a specific goal or objective.
For example, a KPI for an e-commerce website might be the conversion rate, which is the percentage of website visitors who make a purchase. This KPI is specific, measurable, achievable, relevant, and time-bound, as it provides a clear metric for tracking the success of the website’s sales process. Other KPIs might include website traffic, customer retention rate, or average order value.
KPIs are typically used by managers and executives to monitor performance and make informed decisions about how to allocate resources and adjust strategies. By regularly reviewing KPIs, businesses can identify areas of success and areas where improvements are needed, and make data-driven decisions to optimize their operations and achieve their goals.
(b) Explain how to measure SEO efforts.
Measuring the effectiveness of SEO efforts is essential to understanding whether your website is performing well in search engine rankings and whether your SEO strategies are working. Here are some ways to measure SEO efforts:
- Organic search traffic: Monitor the amount of traffic coming to your website through organic search results. Tools like Google Analytics can help you track this.
- Keyword rankings: Track your website’s ranking for specific keywords that you are targeting. This can be done using tools like SEMrush, ahrefs, or Google Search Console.
- Backlinks: Monitor the number of backlinks pointing to your website and the quality of those links. You can use tools like ahrefs, Majestic, or SEMrush to track this.
- Click-through rate (CTR): Measure the percentage of people who click on your website link after seeing it in search engine results. This can be done using Google Search Console.
- Conversion rate: Measure the percentage of visitors who complete a desired action on your website, such as filling out a form or making a purchase.
- Bounce rate: Monitor the percentage of visitors who leave your website after viewing only one page. High bounce rates can indicate that visitors are not finding what they are looking for on your website.
- Page load speed: Check how quickly your website loads, as slow load times can negatively impact search engine rankings and user experience.
- Mobile optimization: Ensure that your website is optimized for mobile devices, as this can impact search engine rankings and user experience.
(c) How can we analyze site search?
Analyzing site search can provide valuable insights into how users are interacting with your website and what they are looking for. Here are some steps for analyzing site search:
- Identify the most popular search terms: Analyze the search terms that users are entering into your site search function. This can help you identify popular topics or products on your website.
- Analyze search queries with no results: Look for search queries that returned no results. This can indicate areas where your website may be lacking content or information that users are looking for.
- Monitor search refinements: Look at how often users refine their search queries. This can provide insights into how well your site search is working and whether users are finding what they are looking for.
- Look at search frequency and exit rates: Analyze the frequency of site searches and the exit rates of users who perform site searches. This can help you understand how often users are resorting to site search and whether they are finding what they need.
- Monitor conversions: Track whether users who perform site searches are more likely to convert or make a purchase on your website. This can help you understand the value of site search and how to optimize it for conversions.
- Analyze search results page: Look at the design and layout of your search results page. Ensure that the page is easy to navigate, displays relevant information, and includes relevant calls-to-action.
OR
(a) How do you measure effectiveness of PPC?
The effectiveness of a Pay-Per-Click (PPC) campaign can be measured using various metrics. Here are some common ways to measure the effectiveness of a PPC campaign:
- Click-Through Rate (CTR): CTR is the ratio of clicks to impressions. A high CTR indicates that your ads are relevant and appealing to your target audience.
- Conversion Rate: Conversion rate is the percentage of clicks that result in a desired action on your website, such as a purchase or sign-up. A high conversion rate indicates that your ads are effectively driving traffic to your website and encouraging users to take action.
- Cost per Click (CPC): CPC is the amount you pay each time someone clicks on your ad. A low CPC indicates that your ads are relevant and well-targeted.
- Cost per Acquisition (CPA): CPA is the amount you pay for each desired action, such as a purchase or sign-up. A low CPA indicates that your ads are effective in driving conversions.
- Return on Ad Spend (ROAS): ROAS is the revenue generated by your PPC campaign divided by the cost of the campaign. A high ROAS indicates that your campaign is generating a positive return on investment.
- Quality Score: Quality Score is a metric used by Google Ads to measure the relevance and quality of your ads. A high Quality Score can lead to lower CPCs and higher ad positions.
- Ad Position: Ad position is the placement of your ad on the search engine results page. A higher ad position can lead to more clicks and conversions.
(b) What tools do you use for email marketing?
As an AI language model, I do not have personal preferences or use tools. However, here are some popular tools used for email marketing:
- Mailchimp: A popular email marketing tool that offers features such as email templates, list management, and marketing automation.
- Constant Contact: An email marketing tool that offers features such as email templates, list management, and event management.
- Campaign Monitor: An email marketing tool that offers features such as email templates, list management, and email tracking.
- HubSpot: A marketing platform that offers features such as email marketing, lead management, and marketing automation.
- ActiveCampaign: A marketing automation tool that offers features such as email marketing, lead management, and customer relationship management.
- Aweber: An email marketing tool that offers features such as email templates, list management, and email tracking.
- ConvertKit: An email marketing tool designed for bloggers and content creators that offers features such as email automation, subscriber tagging, and integrations with popular platforms.
(c) How do you track success of email marketing?
The success of email marketing campaigns can be tracked using various metrics. Here are some common ways to track the success of email marketing:
- Open Rate: Open rate is the percentage of subscribers who opened your email. A high open rate indicates that your subject line was effective in catching the recipient’s attention.
- Click-Through Rate (CTR): CTR is the percentage of subscribers who clicked on a link in your email. A high CTR indicates that your email content was relevant and engaging.
- Conversion Rate: Conversion rate is the percentage of subscribers who completed a desired action, such as making a purchase or signing up for a newsletter. A high conversion rate indicates that your email content was effective in driving conversions.
- Bounce Rate: Bounce rate is the percentage of emails that were not delivered to the recipient’s inbox. A high bounce rate may indicate issues with your email list, such as outdated or invalid email addresses.
- Unsubscribe Rate: Unsubscribe rate is the percentage of subscribers who opted out of receiving future emails from you. A high unsubscribe rate may indicate that your email content or frequency is not meeting the expectations of your subscribers.
- Revenue Generated: If your email campaign is driving sales, you can track the revenue generated from your campaign to determine its success.
- Return on Investment (ROI): ROI is the ratio of revenue generated to the cost of your email campaign. A positive ROI indicates that your campaign was successful in generating revenue for your business.
(a) Is pay-per-click an effective strategy for advertising spend?
Pay-Per-Click (PPC) advertising can be an effective strategy for advertising spend for many businesses, but it depends on various factors such as the industry, competition, budget, and goals of the business.
PPC advertising allows businesses to target specific keywords and demographics to reach their target audience. It can provide quick results and a measurable return on investment (ROI) since you only pay for clicks on your ads. This means that you can optimize your campaign and adjust your budget to maximize the results.
However, PPC advertising can be highly competitive, which means that the cost per click (CPC) can be high for some keywords and industries. Additionally, it requires ongoing management and optimization to ensure that your ads are performing well and generating a positive ROI.
Ultimately, whether or not PPC advertising is an effective strategy for advertising spend depends on your business goals, budget, and industry. It’s important to carefully evaluate the potential ROI and competition before investing in PPC advertising, and to continually monitor and optimize your campaigns for the best results.
(b) Explain Multichannel marketing?
Multichannel marketing is a marketing strategy that involves using multiple channels to reach and engage with a target audience. This means using a combination of digital and traditional marketing channels, such as email, social media, search engine advertising, print advertising, events, and more.
The goal of multichannel marketing is to provide a seamless and consistent experience for the customer across all channels. By reaching customers through different channels, businesses can increase their visibility, reach a wider audience, and engage with customers in a variety of ways.
In multichannel marketing, the channels used should be complementary and work together to achieve the same overall goals. For example, a business might use social media to drive traffic to their website, and then use email marketing to follow up with customers who have shown interest in their products or services.
Effective multichannel marketing requires careful planning and coordination across all channels, as well as a deep understanding of the target audience and their preferences. By using a variety of channels to engage with customers, businesses can create a more personalized and effective marketing experience, build brand loyalty, and ultimately drive revenue.
(c) How do you measure blog performance?
Measuring the performance of a blog can help you understand how well your content is resonating with your audience and identify areas for improvement. Here are some key metrics you can use to measure blog performance:
- Traffic: This measures the number of visitors to your blog. You can use tools like Google Analytics to track traffic and identify trends over time.
- Engagement: This measures how engaged your audience is with your blog content. Engagement metrics include comments, shares, likes, and time on page.
- Conversion: This measures the number of visitors to your blog who take a desired action, such as filling out a form or making a purchase. You can track conversion rates using tools like Google Analytics.
- Backlinks: This measures the number of external websites linking to your blog. Backlinks can improve your search engine rankings and drive more traffic to your blog.
- Social media shares: This measures the number of times your blog posts are shared on social media. Social media shares can increase your reach and drive more traffic to your blog.
- Bounce rate: This measures the percentage of visitors who leave your blog after viewing only one page. A high bounce rate may indicate that your content is not engaging or relevant to your target audience.
OR
(a) What are streaming analytics?
Streaming analytics, also known as real-time analytics or event stream processing, refers to the process of analyzing data as it is generated, typically from a continuous stream of events or data. Streaming analytics allows organizations to analyze data in real-time, enabling them to make faster, more informed decisions based on current, accurate information.
Streaming analytics technologies are designed to handle high volumes of data and analyze it in real-time. These technologies use complex algorithms and machine learning techniques to identify patterns, anomalies, and trends in the data, and to deliver insights and alerts in real-time. Some common use cases for streaming analytics include fraud detection, predictive maintenance, real-time monitoring and alerting, and personalized marketing.
With the rise of the Internet of Things (IoT) and the proliferation of connected devices, streaming analytics has become increasingly important for businesses looking to leverage real-time data to improve their operations, customer experiences, and bottom line. Streaming analytics technologies are used in a variety of industries, including finance, healthcare, manufacturing, and retail, among others.
(b) How to test Test price and Promotions
Testing prices and promotions is an important aspect of marketing and can help businesses optimize their pricing strategies and promotional campaigns. Here are some steps to test prices and promotions:
- Set goals: Before testing prices and promotions, it’s important to define your goals. This could be to increase sales, improve margins, attract new customers, or retain existing ones.
- Choose products to test: Select a few products to test the pricing or promotion strategy on. It’s best to choose products that are representative of your business and have a good sales history.
- Create a control group: To test the effectiveness of your pricing or promotion strategy, create a control group of customers who will not receive the promotional offer or discounted price. This will help you measure the impact of the strategy.
- Test the strategy: Test your pricing or promotion strategy with the test group of customers. This could involve offering a discount on a specific product, running a promotion for a limited time, or testing different price points for a product.
- Measure the results: After the test period is over, measure the results of the pricing or promotion strategy. This could include tracking sales, customer behavior, and revenue.
- Analyze the results: Analyze the results to determine the effectiveness of the pricing or promotion strategy. If the strategy was successful, consider implementing it more broadly. If it was not successful, try adjusting the strategy and testing again.
(c) Explain On-page SEO and Off-page SEO.
On-page SEO and off-page SEO are two key components of search engine optimization (SEO), which is the practice of optimizing a website to improve its search engine rankings and visibility in search engine results pages (SERPs). Here’s an overview of each:
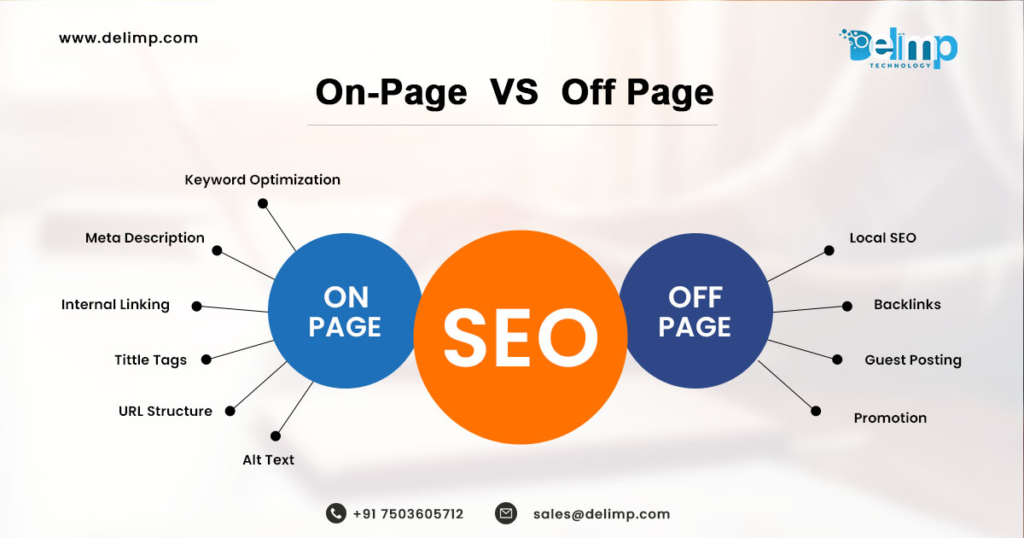
On-page SEO: On-page SEO refers to the optimization of various elements on a website to improve its search engine rankings. This includes optimizing page titles, meta descriptions, header tags, images, and content for relevant keywords. On-page SEO also involves improving the user experience on a website by making it easy to navigate and ensuring that the content is valuable and relevant to users. By optimizing these on-page elements, search engines can better understand the content of a website, which can lead to higher rankings in SERPs.
Off-page SEO: Off-page SEO refers to the optimization of external factors that influence a website’s search engine rankings. This includes link building, social media marketing, and other external marketing strategies that help to build a website’s reputation and authority. The number and quality of external links pointing to a website are key factors in determining its authority in the eyes of search engines. In addition to link building, off-page SEO also involves engaging with social media and other online communities to promote a website’s content and build its reputation. By building strong relationships and engaging with online communities, websites can improve their visibility in search engine results pages.
(a) What are the responsibilities of webmaster?
The responsibilities of a webmaster can vary depending on the organization and the website, but typically include:
- Website development: Developing and maintaining the website, including designing and updating web pages, creating new features, and ensuring the website is functioning properly.
- Content management: Managing the content on the website, including creating, editing, and publishing content, and ensuring it is accurate, up-to-date, and consistent with the organization’s brand and messaging.
- Search engine optimization (SEO): Optimizing the website to improve its search engine rankings and visibility in search engine results pages (SERPs), including keyword research, on-page optimization, and link building.
- Web analytics: Monitoring and analyzing website performance using tools such as Google Analytics, and making recommendations for improvements based on the data.
- Website security: Ensuring the website is secure from potential threats, including malware, hacking, and other security vulnerabilities.
- Website testing: Testing the website to ensure it is functioning properly and identifying and addressing any bugs or issues that arise.
- Website performance: Ensuring the website is optimized for speed and performance, including monitoring page load times and taking steps to improve performance as needed.
- Website updates and maintenance: Keeping the website up-to-date with the latest technology and security updates, and making regular updates and changes as needed.
(b) Discuss various media and channels of marketing
There are many different media and channels of marketing that businesses can use to reach their target audience. Here are some of the most common ones:
- Digital Marketing: Digital marketing encompasses a wide range of online channels, including search engine marketing (SEM), search engine optimization (SEO), social media marketing, email marketing, influencer marketing, and content marketing.
- Television Advertising: Television advertising is still a popular medium for reaching large audiences with a visual message. This can include commercials, sponsorships, and product placement.
- Radio Advertising: Radio advertising is a cost-effective way to reach targeted audiences through targeted programming and stations. This can include commercials and sponsorships.
- Print Advertising: Print advertising includes newspaper and magazine ads, direct mail marketing, and billboards. This is a traditional medium, but still has an important place in marketing strategies.
- Out-of-Home (OOH) Advertising: OOH advertising includes billboards, signs, and other types of advertisements that are placed in public places like highways, airports, and bus stops.
- Events and Experiential Marketing: Events and experiential marketing include trade shows, conferences, sponsorships, and other types of events that allow businesses to connect with their target audience in person.
- Public Relations: Public relations includes efforts to build a positive reputation for a business, such as press releases, media coverage, and crisis management.
- Direct Marketing: Direct marketing includes strategies like telemarketing, direct mail, and email marketing to target specific audiences with a personalized message.
- Referral Marketing: Referral marketing encourages customers to refer their friends and family to a business in exchange for rewards, discounts, or other incentives.
- Word-of-Mouth Marketing: Word-of-mouth marketing relies on customers to spread the word about a business to their friends and family.
(c) Explain OSI Model with all layers in detail.
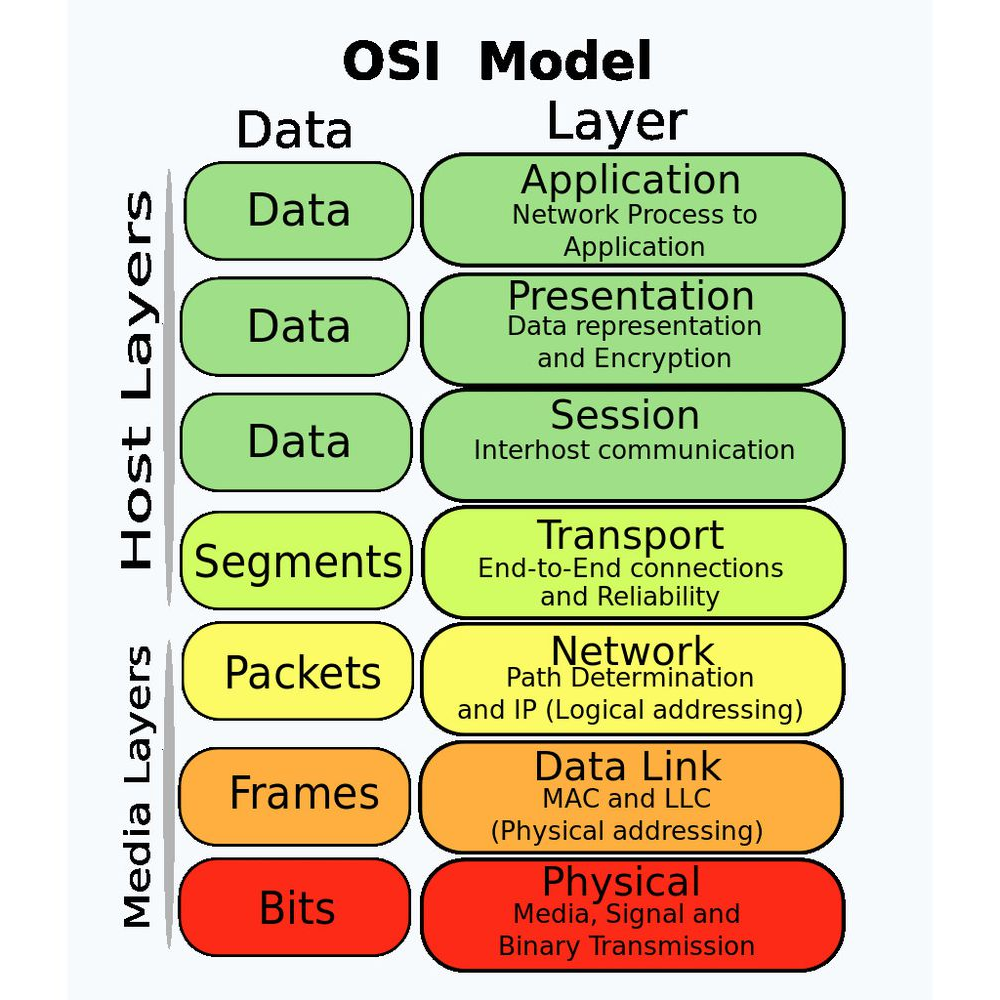
The OSI (Open Systems Interconnection) model is a conceptual framework that describes how data is transmitted and received over a network. It consists of seven layers, each of which performs a specific function in the communication process.
Here are the seven layers of the OSI model, listed in order from the lowest to the highest:
- Physical Layer: The physical layer is responsible for transmitting raw data bits over a physical medium, such as a copper wire or optical fiber. It defines the electrical, mechanical, and physical specifications for the physical medium, such as the cable type, connector type, and transmission speed. This layer also deals with issues such as data encoding and modulation.
- Data Link Layer: The data link layer is responsible for providing error-free transmission of data frames over a physical medium. It includes two sub-layers: the Media Access Control (MAC) layer and the Logical Link Control (LLC) layer. The MAC layer is responsible for controlling access to the physical medium and ensuring that data frames are transmitted without collisions. The LLC layer is responsible for managing frame synchronization, flow control, and error checking.
- Network Layer: The network layer is responsible for routing data packets between different networks. It determines the best path for data packets to take through the network, based on the network topology and the destination address of the packet. It also provides services such as addressing, fragmentation, and reassembly of packets.
- Transport Layer: The transport layer is responsible for providing reliable and error-free transmission of data between applications running on different devices. It includes two main protocols: Transmission Control Protocol (TCP) and User Datagram Protocol (UDP). TCP provides a reliable, connection-oriented transmission of data, while UDP provides a faster, connectionless transmission of data.
- Session Layer: The session layer is responsible for establishing, maintaining, and terminating sessions between applications running on different devices. It provides services such as authentication, authorization, and session synchronization.
- Presentation Layer: The presentation layer is responsible for translating data into a format that can be understood by the application layer. It deals with issues such as data compression, encryption, and data conversion.
- Application Layer: The application layer is responsible for providing network services to end-users. It includes protocols such as HTTP (Hypertext Transfer Protocol), FTP (File Transfer Protocol), SMTP (Simple Mail Transfer Protocol), and Telnet (Terminal Network Protocol).
OR
(a) Write down the steps to create web analytics report.
Creating a web analytics report involves several steps, including:
- Determine the goals of your report: Before starting to create a web analytics report, you should determine what information you want to communicate and who the target audience is. Your goals will guide you in selecting the metrics and data to include in the report.
- Collect and analyze data: Use a web analytics tool like Google Analytics to collect and analyze data about your website’s traffic, user behavior, and conversion rates. Analyze this data to identify trends, patterns, and opportunities for improvement.
- Select relevant metrics: Choose metrics that align with your goals and provide insight into your website’s performance. Examples of relevant metrics include bounce rate, page views, time on site, conversion rate, and referral sources.
- Organize data into a report: Create a visual representation of the data you have collected and analyzed. Organize the data into charts, graphs, tables, and other visual aids that are easy to understand and interpret.
- Interpret the data: Provide context and interpretation for the data presented in the report. Explain what the data means in terms of your goals, and offer recommendations for how to improve your website’s performance.
- Create a summary and executive summary: Create a summary of the report’s findings that highlights the most important data and insights. This can be a helpful reference for stakeholders who don’t have time to read the entire report. An executive summary is also useful for providing a high-level overview of the report’s key findings.
- Present the report: Share the report with stakeholders, including website owners, marketers, and executives. Present the report in a way that is easy to understand and visually appealing, using tools like PowerPoint or Google Slides to create an engaging presentation. Be prepared to answer questions and provide additional context as needed.
- Act on the insights: Use the insights from the report to make data-driven decisions about your website’s design, content, and marketing strategy. Continuously monitor and analyze your website’s performance to track progress towards your goals and identify new opportunities for improvement.
(b) Explain the protocols involved with application layer.
The application layer is the topmost layer of the OSI (Open Systems Interconnection) model and is responsible for providing services and protocols that enable communication between applications running on different networked devices. Some of the common protocols associated with the application layer are:
- HTTP (Hypertext Transfer Protocol): HTTP is the primary protocol used for communication between web servers and web browsers. It enables the transfer of hypertext documents (web pages) and other content over the internet.
- FTP (File Transfer Protocol): FTP is a protocol used for transferring files between networked devices. It provides a standard way to transfer files between servers and clients.
- SMTP (Simple Mail Transfer Protocol): SMTP is a protocol used for sending and receiving email messages. It provides a standard way to send and receive email messages over the internet.
- DNS (Domain Name System): DNS is a protocol used for translating human-readable domain names into IP addresses that computers can understand. It provides a way to locate network resources such as servers and websites using their domain names.
- Telnet: Telnet is a protocol that allows remote access to networked devices. It enables a user to access a command-line interface on a remote device and perform tasks as if they were physically present.
- SSH (Secure Shell): SSH is a protocol used for secure remote access to networked devices. It provides a secure encrypted connection between the client and the server, ensuring that the data transmitted between them is protected from interception and tampering.
- SNMP (Simple Network Management Protocol): SNMP is a protocol used for monitoring and managing networked devices. It provides a standard way to collect and organize information about network devices, including their performance, status, and configuration.
These protocols work together to enable communication between applications running on different devices. By using these protocols, applications can communicate with each other, transfer data, and access network resources in a standardized and secure way.
(c) Explain the process of website testing.
Website testing is the process of checking a website’s functionality, usability, and performance to ensure that it meets the desired requirements and delivers a positive user experience. The testing process typically involves the following steps:
- Requirement analysis: The first step is to review the website’s requirements to understand its purpose, features, and functionality. This step helps to establish a clear set of objectives for the testing process.
- Test planning: Based on the requirements, a comprehensive test plan is created that outlines the testing scope, test cases, test data, and testing timelines.
- Functional testing: Functional testing involves checking the website’s core functionality, including its navigation, links, forms, and other interactive elements. The goal is to ensure that the website is working as intended and that there are no functional defects or errors.
- Usability testing: Usability testing involves assessing the website’s ease of use, user interface, and overall user experience. Testers evaluate the website’s design, layout, and accessibility to ensure that it is user-friendly and intuitive.
- Performance testing: Performance testing involves checking the website’s speed, scalability, and reliability. Testers simulate different usage scenarios and traffic loads to assess the website’s performance under varying conditions.
- Security testing: Security testing involves checking the website’s vulnerability to various security threats such as hacking, malware, and data breaches. The goal is to identify any weaknesses or vulnerabilities in the website’s security infrastructure and ensure that sensitive user data is protected.
- Cross-browser testing: Cross-browser testing involves checking the website’s compatibility across different web browsers and operating systems. Testers verify that the website looks and functions correctly on all major browsers, including Chrome, Firefox, Safari, and Internet Explorer.
- Regression testing: Regression testing involves retesting the website after making any changes or updates to ensure that the changes have not introduced any new defects or issues.
- Test reporting: The final step is to create a comprehensive test report that summarizes the testing results, including any defects or issues identified, and provides recommendations for improvement.
“Do you have the answer to any of the questions provided on our website? If so, please let us know by providing the question number and your answer in the space provided below. We appreciate your contributions to helping other students succeed.”