Here, We provide Big Data Analytics GTU Paper Solution Winter 2022. Read the Full BDA GTU paper solution given below.

Big Data Analytics GTU Old Paper Winter 2022 [Marks : 70] : Click Here
(a) What is Big Data? Explain characteristics of Big Data.
Big data refers to extremely large and complex data sets that require advanced technologies and methods to capture, store, manage, and analyze. Big data is characterized by the 3 Vs: volume, velocity, and variety.
- Volume: Big data refers to massive amounts of data that can range from terabytes to petabytes or even exabytes in size. This data can be structured, semi-structured, or unstructured and can come from various sources such as social media, sensors, or business transactions.
- Velocity: Big data is generated and collected at an unprecedented speed, requiring real-time or near real-time analysis. For example, social media data is generated continuously, and stock market data changes rapidly.
- Variety: Big data comes in different forms, such as structured, semi-structured, and unstructured. Structured data is highly organized and can be easily analyzed using traditional methods, while unstructured data is not organized and can be more difficult to analyze. Semi-structured data falls in between these two categories.
- Veracity: Big data can be noisy and contain inaccuracies, making it challenging to extract insights.
- Value: Big data can provide valuable insights that can inform business decisions, optimize processes, and improve customer experience.
- Variability: Big data can be inconsistent, and the meaning of data may change over time.
(b) Define features of Big Data.
The features of Big Data can be summarized by the 5 Vs:
- Volume: Big Data refers to vast amounts of data that exceed the processing capacity of traditional database systems. This data can come from various sources such as social media, IoT devices, and business transactions. The volume of data is constantly growing, and organizations must have the necessary infrastructure to store and manage it.
- Velocity: Big Data is generated and collected at a high speed, requiring real-time or near-real-time processing. For example, stock market data changes rapidly, and social media data is generated continuously. Organizations must have the tools and technologies to process data quickly to extract insights and make informed decisions.
- Variety: Big Data comes in different formats, such as structured, semi-structured, and unstructured. Structured data is highly organized and can be easily analyzed using traditional methods, while unstructured data is not organized and can be more challenging to analyze. Semi-structured data falls between these two categories.
- Veracity: Big Data can be noisy and contain inaccuracies, making it difficult to extract meaningful insights. Organizations must have the tools and techniques to clean and preprocess the data before analysis.
- Value: Big Data can provide valuable insights that can inform business decisions, optimize processes, and improve customer experience. However, organizations must have the skills and expertise to analyze the data and extract insights that drive business outcomes.
(c) Explain Map-Reduce framework in detail. Draw the architectural
diagram for Physical Organization of Computer Nodes.
The MapReduce framework is a programming model and data processing paradigm that is designed to process large and complex datasets in a distributed computing environment. It consists of two main phases: the Map phase and the Reduce phase.
The Map phase takes an input dataset and processes it in parallel across multiple nodes in a distributed computing environment. The input data is divided into smaller chunks, and each chunk is processed by a map function in parallel across multiple nodes. The output of the map function is a set of key-value pairs that are then shuffled and sorted by key.
The Reduce phase takes the output of the Map phase and processes it in parallel across multiple nodes. The key-value pairs are grouped by key, and each group is processed by a reduce function in parallel across multiple nodes. The output of the reduce function is a set of key-value pairs that are written to an output file.
The MapReduce framework is typically implemented on a cluster of commodity hardware nodes that are connected through a high-speed network. The nodes are organized into a master node and multiple worker nodes.
The master node manages the overall job execution and coordinates the tasks performed by the worker nodes. It divides the input data into smaller chunks and assigns each chunk to a worker node for processing. It also collects and combines the output of the worker nodes into a final output file.
The worker nodes perform the actual processing of the input data. Each worker node runs a copy of the map function and reduce function and processes the assigned chunk of data. The worker nodes communicate with each other and with the master node through the network.
The physical organization of computer nodes in a MapReduce cluster can be depicted as a layered architecture. At the bottom layer, there are the commodity hardware nodes that are connected through a high-speed network. On top of this layer, there is the Hadoop Distributed File System (HDFS) that provides distributed storage for the input and output data. On top of the HDFS layer, there is the MapReduce layer that provides the programming model and data processing framework. Finally, at the top layer, there is the application layer that provides the actual data processing application.
(a) Explain unstructured, semi-structured and structured data with one
example of each.
Data can be classified into three main categories based on their level of organization and structure: unstructured, semi-structured, and structured data.
Unstructured data refers to data that does not have a defined structure or format. This type of data is usually not organized and can be difficult to analyze using traditional methods. Examples of unstructured data include social media posts, videos, images, audio recordings, and text documents such as emails.
For example, unstructured data can be an unedited video of a customer review about a product or service. It can be difficult to extract valuable insights from this data since it may contain irrelevant or redundant information, and it requires advanced natural language processing techniques to identify key themes and topics.
Semi-structured data refers to data that has some form of structure or format but does not fit into the rigid structure of traditional databases. Semi-structured data can contain tags, metadata, or other markers that help to identify the structure and relationships between different elements in the data. Examples of semi-structured data include XML and JSON files.
For example, semi-structured data can be a customer review in JSON format that includes structured information such as product rating, date, and reviewer name. The data may also include unstructured information such as the review text. The structured information can be easily analyzed using traditional methods, while the unstructured information requires advanced text analytics techniques.
Structured data refers to data that has a defined structure and format and can be easily analyzed using traditional database methods. Structured data is highly organized and can be easily queried and analyzed using SQL or other similar tools. Examples of structured data include customer data, sales data, and financial data.
For example, structured data can be a database table that contains customer information such as name, address, phone number, and email address. This data can be easily queried and analyzed using SQL to extract valuable insights such as customer demographics and purchase behavior.
(b) Write the use and syntax of following HDFS commands:
i. put
ii. chmod
iii. get
i. put: The put command is used to copy files or directories from the local file system to the Hadoop Distributed File System (HDFS). The syntax of the put command is as follows:
hdfs dfs -put <localsrc> <dst>
<localsrc>: The path of the local file or directory that you want to copy to HDFS.<dst>: The destination path on HDFS where you want to store the copied file or directory.
For example, to copy a file named file.txt from the local file system to HDFS at the path /user/hadoop/input, you would use the following command:
hdfs dfs -put file.txt /user/hadoop/input
ii. chmod: The chmod command is used to change the file permissions of files or directories in HDFS. The syntax of the chmod command is as follows:
hdfs dfs -chmod <MODE> <PATH>
<MODE>: The new permissions that you want to set for the file or directory, expressed in octal notation.<PATH>: The path of the file or directory whose permissions you want to change.
For example, to set the permissions of a file named file.txt in HDFS at the path /user/hadoop/input to read and write for the owner and only read for everyone else, you would use the following command:
hdfs dfs -chmod 644 /user/hadoop/input/file.txt
iii. get: The get command is used to copy files or directories from HDFS to the local file system. The syntax of the get command is as follows:
hdfs dfs -get <src> <localdst>
<src>: The path of the file or directory that you want to copy from HDFS.<localdst>: The destination path on the local file system where you want to store the copied file or directory.
For example, to copy a file named file.txt from HDFS at the path /user/hadoop/output to the local file system at the path /home/hadoop/data, you would use the following command:
hdfs dfs -get /user/hadoop/output/file.txt /home/hadoop/data(c) Write Map Reduce code for counting occurrences of words in the input
text file.
Here’s an example MapReduce code for counting the occurrences of words in an input text file:
Mapper:
import java.io.IOException;
import org.apache.hadoop.io.*;
import org.apache.hadoop.mapreduce.*;

public class WordCountMapper extends Mapper<LongWritable, Text, Text, IntWritable> {

    private final static IntWritable one = new IntWritable(1);
    private Text word = new Text();

    public void map(LongWritable key, Text value, Context context) throws IOException, InterruptedException {
        String line = value.toString();
        String[] words = line.split("\\s+");

        for (String word : words) {
            this.word.set(word);
            context.write(this.word, one);
        }
    }
}
Reducer:
import java.io.IOException;
import org.apache.hadoop.io.*;
import org.apache.hadoop.mapreduce.*;

public class WordCountReducer extends Reducer<Text, IntWritable, Text, IntWritable> {

    public void reduce(Text key, Iterable<IntWritable> values, Context context) throws IOException, InterruptedException {
        int sum = 0;
        for (IntWritable value : values) {
            sum += value.get();
        }
        context.write(key, new IntWritable(sum));
    }
}
Driver:
import org.apache.hadoop.fs.Path;
import org.apache.hadoop.io.*;
import org.apache.hadoop.mapreduce.*;
import org.apache.hadoop.mapreduce.lib.input.FileInputFormat;
import org.apache.hadoop.mapreduce.lib.output.FileOutputFormat;

public class WordCount {

    public static void main(String[] args) throws Exception {
        if (args.length != 2) {
            System.err.println("Usage: WordCount <input path> <output path>");
            System.exit(-1);
        }

        Job job = Job.getInstance();
        job.setJarByClass(WordCount.class);
        job.setJobName("Word Count");

        FileInputFormat.addInputPath(job, new Path(args[0]));
        FileOutputFormat.setOutputPath(job, new Path(args[1]));

        job.setMapperClass(WordCountMapper.class);
        job.setReducerClass(WordCountReducer.class);

        job.setOutputKeyClass(Text.class);
        job.setOutputValueClass(IntWritable.class);

        System.exit(job.waitForCompletion(true) ? 0 : 1);
    }
}
Explanation:
The WordCountMapper class extends the Mapper class and overrides the map method to tokenize the input text file into words, and emit a key-value pair for each word with a value of 1. The WordCountReducer class extends the Reducer class and overrides the reduce method to aggregate the counts of each word emitted by the mapper. The driver code in the WordCount class configures the job and sets the input and output paths, mapper and reducer classes, and output key-value types. It then submits the job for execution and waits for it to complete.
(c) What is apache hadoop? Explain hadoop Eco-system.
Apache Hadoop is a popular open-source software framework that is used for distributed storage and processing of large data sets. Hadoop is designed to handle data sets that are too large to be processed on a single machine by breaking them into smaller chunks and distributing them across a cluster of commodity hardware. Hadoop is built using two main components:
- Hadoop Distributed File System (HDFS): A distributed file system that allows large data sets to be stored across multiple machines in a cluster.
- MapReduce: A parallel programming model for processing large data sets that allows developers to write programs that can run in parallel across a cluster of machines.
Hadoop Ecosystem refers to the collection of open-source tools, projects, and frameworks that are built around the core Hadoop components. The Hadoop Ecosystem is constantly evolving and expanding, but some of the most important tools and frameworks include:
- Apache Pig: A high-level language for querying and analyzing large data sets.
- Apache Hive: A data warehousing and SQL-like query language that runs on top of Hadoop.
- Apache Spark: A fast and general-purpose data processing engine that can run in-memory computations and has support for various programming languages.
- Apache Storm: A real-time stream processing system that can process large streams of data in real-time.
- Apache Flume: A distributed, reliable, and available system for efficiently collecting, aggregating, and moving large amounts of log data.
- Apache HBase: A NoSQL database that can store large amounts of structured data and can be used for random real-time read/write access to Big Data.
- Apache Sqoop: A tool for importing data from structured data stores such as relational databases to Hadoop.
- Apache ZooKeeper: A distributed coordination service that provides distributed synchronization and configuration management for distributed applications.
- Apache Mahout: A machine learning library that provides scalable implementations of various machine learning algorithms.
(a) Explain “Shuffle & Sort” phase and “Reducer Phase” in MapReduce.
The Shuffle and Sort phase and the Reducer phase are two important steps in the MapReduce data processing model.
The Shuffle and Sort phase occurs after the Map phase has completed. In this phase, the MapReduce framework takes the output of the Map tasks and groups them by their keys. The data is then sorted by key, so that all the values with the same key are grouped together. This process is called shuffling and sorting, and it ensures that all the values for a given key are processed together in the Reducer phase. The Shuffle and Sort phase is responsible for transferring data from the Map tasks to the Reducer tasks.
The Reducer phase is the final phase in the MapReduce processing model. In this phase, the Reducer tasks receive the output from the Map tasks, which has been shuffled and sorted by key. The Reducer tasks then process the data and produce the final output. The Reducer tasks process one group of values at a time, with each group containing all the values for a particular key. The Reducer tasks can perform various operations on the data, such as counting, summing, averaging, or any other operation that is required for the processing task. The output of the Reducer tasks is then stored in the Hadoop Distributed File System (HDFS) or any other output location specified by the MapReduce job.
(b) Mention few applications where big data analytics are useful. Describe
in brief.
Big data analytics is being used in various applications across different industries, some of which include:
- Healthcare: Big data analytics is used in healthcare to improve patient care and outcomes. With the help of big data analytics, healthcare providers can analyze large amounts of patient data to identify patterns, trends, and anomalies that can help them make better decisions. For example, big data analytics can be used to develop personalized treatment plans based on patient data.
- Finance: Big data analytics is used in finance to identify fraud, predict market trends, and improve risk management. With the help of big data analytics, financial institutions can analyze large amounts of transactional data to identify patterns and anomalies that could indicate fraud. Big data analytics can also be used to predict market trends and improve risk management by identifying potential risks and threats.
- Retail: Big data analytics is used in retail to improve customer engagement, enhance the customer experience, and increase sales. With the help of big data analytics, retailers can analyze customer data to identify patterns and trends, which can help them develop targeted marketing campaigns and personalized offers for customers.
- Manufacturing: Big data analytics is used in manufacturing to optimize production processes, improve quality control, and reduce downtime. With the help of big data analytics, manufacturers can analyze sensor data from machines and equipment to identify patterns and anomalies that could indicate maintenance issues or quality control problems.
- Transportation: Big data analytics is used in transportation to improve logistics, reduce costs, and enhance safety. With the help of big data analytics, transportation companies can analyze data from GPS systems, traffic sensors, and other sources to optimize routes, reduce fuel consumption, and improve safety by identifying potential hazards and risks.
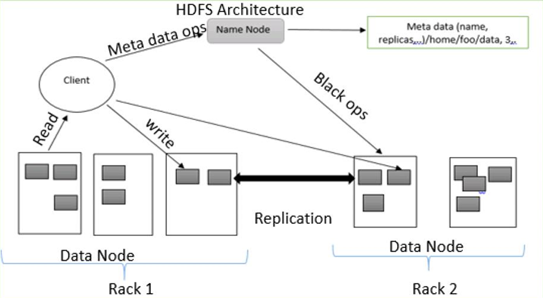
(c) Define HDFS. Describe namenode, datanode and block. Explain HDFS
operations in detail.
HDFS, or Hadoop Distributed File System, is a distributed file system that is designed to store and manage large amounts of data across multiple machines in a Hadoop cluster. HDFS is one of the core components of the Hadoop ecosystem, and is designed to be highly fault-tolerant and scalable.
There are three main components in the HDFS architecture:
- Namenode: The Namenode is the central node in the HDFS cluster, and is responsible for managing the file system namespace and the metadata for all the files and directories stored in the HDFS cluster. The Namenode keeps track of the location of all the data blocks in the cluster, and is responsible for coordinating the storage and retrieval of data blocks.
- Datanode: The Datanode is a node in the HDFS cluster that stores the actual data blocks. Each Datanode is responsible for storing a subset of the data blocks in the cluster, and communicates with the Namenode to report the status of the blocks it is storing.
- Block: A block is the basic unit of storage in HDFS. By default, HDFS stores data in blocks of 128MB or 256MB, although this can be customized depending on the needs of the application.
HDFS supports various operations for managing data in the cluster. Some of the important operations are:
- Read: The read operation is used to retrieve data from HDFS. Clients can read data from HDFS using various APIs provided by Hadoop, such as HDFS API, MapReduce API, or Spark API.
- Write: The write operation is used to store data in HDFS. Clients can write data to HDFS using various APIs provided by Hadoop, such as HDFS API, MapReduce API, or Spark API.
- Append: The append operation is used to add data to an existing file in HDFS. Clients can append data to a file using the HDFS API or other APIs provided by Hadoop.
- Delete: The delete operation is used to remove files or directories from HDFS. Clients can delete files or directories using the HDFS API or other APIs provided by Hadoop.
- Copy: The copy operation is used to create a duplicate copy of a file in HDFS. Clients can copy files using the HDFS API or other APIs provided by Hadoop.
- Move: The move operation is used to move a file or directory from one location to another in HDFS. Clients can move files or directories using the HDFS API or other APIs provided by Hadoop.
OR
(a) Discuss Machine Learning with MLlib in SPARK.
Machine learning is the process of training computer algorithms to make predictions or take actions based on data. Apache Spark provides a powerful and scalable platform for running machine learning algorithms through its MLlib library.
MLlib is a distributed machine learning library for Spark that provides various algorithms and tools for machine learning tasks such as classification, regression, clustering, and collaborative filtering. MLlib is designed to work seamlessly with Spark’s distributed data processing capabilities, allowing it to efficiently process and analyze large datasets.
Some of the key features of MLlib include:
- Scalability: MLlib is designed to work with large datasets, and can distribute computations across multiple machines in a Spark cluster to achieve high scalability.
- Performance: MLlib is built on top of Spark’s distributed computing framework, which allows it to process data in-memory and achieve high performance.
- Ease of use: MLlib provides a simple and easy-to-use API that allows users to quickly build and train machine learning models without requiring deep knowledge of distributed systems or parallel programming.
Some of the popular machine learning algorithms supported by MLlib include:
- Linear regression
- Logistic regression
- Decision trees
- Random forests
- Gradient-boosted trees
- Support vector machines
- K-means clustering
- Principal component analysis
- Collaborative filtering
To use MLlib in Spark, you need to first import the relevant libraries and initialize a SparkSession. Once you have loaded your data into a Spark DataFrame, you can use MLlib’s API to train and evaluate machine learning models. Here is an example of how to train a logistic regression model in Spark using MLlib:
from pyspark.ml.classification import LogisticRegression

# Load data into a DataFrame
data = spark.read.format("libsvm").load("sample_libsvm_data.txt")

# Split the data into training and test sets
train, test = data.randomSplit([0.7, 0.3])

# Initialize a logistic regression model
lr = LogisticRegression(maxIter=10, regParam=0.3, elasticNetParam=0.8)

# Train the model on the training data
model = lr.fit(train)

# Evaluate the model on the test data
result = model.transform(test)
(b) Explain “Map Phase” and “Combiner Phase” in MapReduce.
In MapReduce, the “Map Phase” is the first stage of the process, where the input data is processed in parallel across multiple nodes in a cluster. During the Map Phase, the input data is split into chunks, and each chunk is processed by a separate Map task.
The Map task takes the input data and applies a user-defined function (the “map” function) to transform the data into a set of intermediate key-value pairs. These intermediate key-value pairs are then sorted and partitioned based on the keys, and sent to the “Reduce Phase” for further processing.
The “Combiner Phase” is an optional intermediate step that can be used to improve the efficiency of the MapReduce job. The Combiner function is essentially a “mini-reduce” function that is applied locally on each node to combine the intermediate key-value pairs generated by the Map function.
By applying the Combiner function locally on each node, we can reduce the amount of data that needs to be transferred across the network during the Reduce Phase. This can significantly reduce the overall processing time and network bandwidth requirements of the job.
The Combiner function is not always applicable to every MapReduce job, as it depends on the specific nature of the problem and the output of the Map function. However, if the Map function generates a large amount of intermediate data that can be aggregated locally, using a Combiner function can be a very effective optimization technique.
(c) Write short note on Hive components with a neat diagram.
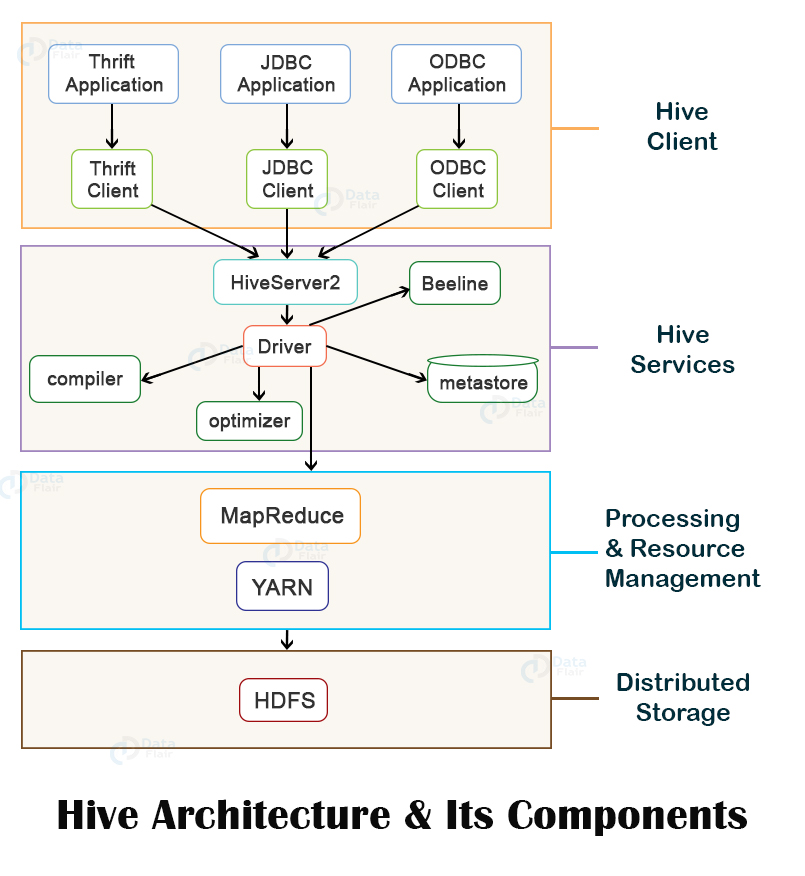
Apache Hive is a data warehousing tool built on top of Hadoop, designed to facilitate querying and managing large datasets stored in HDFS. Hive provides a SQL-like interface called HiveQL that allows users to write SQL-like queries to extract data from Hadoop.
The Hive architecture consists of several components, each with its own specific function. The major components of Hive are as follows:
- Metastore: The Metastore is a centralized repository that stores metadata about Hive tables, partitions, and storage locations. This metadata includes information such as table schema, column names, data types, and storage format. The Metastore can be implemented using various databases, including MySQL, PostgreSQL, and Oracle.
- Driver: The Driver is the main component responsible for processing queries submitted by users. It is responsible for parsing the HiveQL query, optimizing the query plan, and executing the query against the appropriate data stored in Hadoop.
- Compiler: The Compiler takes the logical plan generated by the Driver and transforms it into a physical execution plan that can be executed by the Hadoop MapReduce framework.
- Execution Engine: The Execution Engine is responsible for executing the physical execution plan generated by the Compiler. The Execution Engine interacts with the Hadoop MapReduce framework to execute the query against the data stored in Hadoop.
- User Interface: The User Interface provides an interface for users to interact with Hive. The User Interface can be implemented using various tools, including the Hive CLI, Hive Web UI, or third-party tools like Tableau and Power BI.
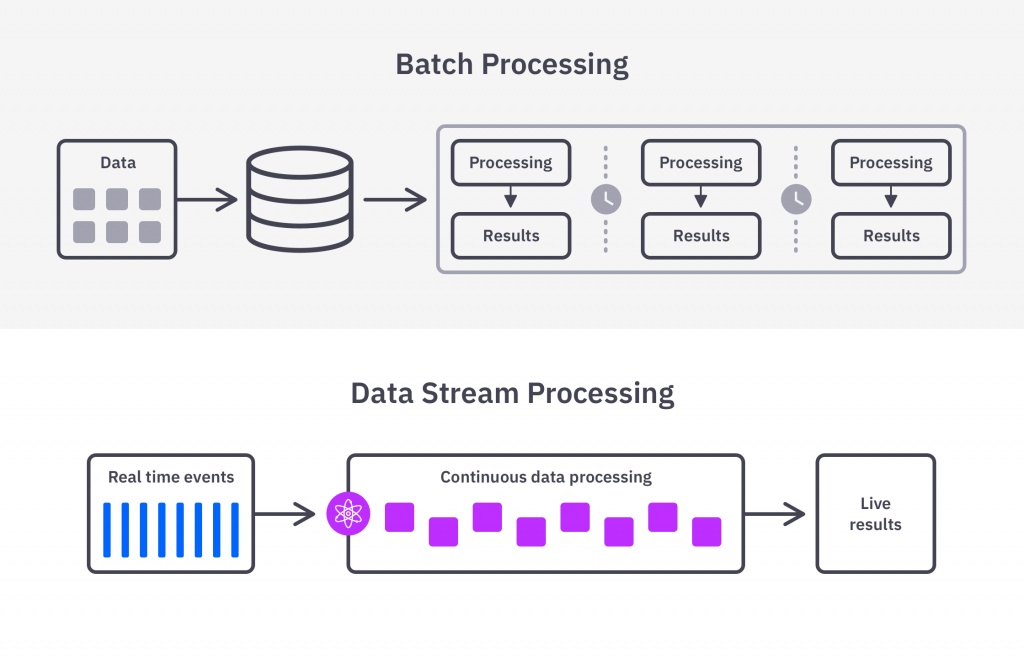
(a) What is the need of Data Stream? Explain.
Data stream refers to a continuous flow of data that is generated at a high velocity, in real-time or near real-time. The data in a data stream is unbounded, meaning that it does not have a definite beginning or end, and it keeps arriving continuously.
The need for data stream arises from the fact that in many domains, such as finance, healthcare, transportation, and social media, data is generated at an unprecedented rate and speed. This data needs to be processed, analyzed, and acted upon in real-time or near real-time to extract valuable insights and make informed decisions. In such scenarios, traditional batch processing techniques, which process data in batches after a certain interval, are not effective.
Data stream processing systems are designed to handle this kind of continuous and fast data by processing it in real-time or near real-time as it arrives. These systems use specialized algorithms and techniques that are designed to handle the unbounded and high-velocity nature of data streams.
The need for data stream processing has grown rapidly in recent years due to the increasing amount of data generated by various sources such as IoT devices, social media platforms, sensors, and other data sources. It is also becoming increasingly important for businesses to make quick decisions based on real-time data insights. Hence, data stream processing has become an essential tool for various industries such as finance, healthcare, telecommunications, and retail, among others.
(b) Which types of databases used in NoSQL?
NoSQL databases use different types of data models for storing and retrieving data. Some of the popular data models used in NoSQL databases are:
- Document databases: These databases store data in a document format such as JSON, XML, or BSON. Each document contains one or more fields and can be nested or hierarchically structured. Examples of document databases include MongoDB and Couchbase.
- Key-value databases: These databases store data in a key-value pair format, where each value is associated with a unique key. Key-value databases are highly scalable and can handle large volumes of data with low latency. Examples of key-value databases include Redis and Riak.
- Column-family databases: These databases store data in columns rather than rows, making them highly scalable and efficient for storing and retrieving large amounts of data. Column-family databases are designed to handle unstructured or semi-structured data. Examples of column-family databases include Apache Cassandra and HBase.
- Graph databases: These databases store data in nodes and edges, allowing for the creation of complex relationships and connections between data points. Graph databases are highly efficient for handling data that has a complex web of relationships, such as social networks or recommendation engines. Examples of graph databases include Neo4j and OrientDB.
(c) Explain the concept of Estimating Moments
In statistics and probability theory, moments are numerical quantities that are used to describe the shape, location, and variability of a probability distribution. The concept of estimating moments involves using a sample of data to estimate the moments of a population distribution.
The first moment of a distribution is its mean or expected value, which provides information about the central tendency of the distribution. The second moment is the variance, which measures the dispersion or spread of the distribution. The third and fourth moments are skewness and kurtosis, respectively, which provide information about the symmetry and tail behavior of the distribution.
To estimate the moments of a population distribution, we can use the sample moments, which are calculated using the sample data. For example, the sample mean is the arithmetic average of the sample data, and the sample variance is the average squared deviation from the mean.
The accuracy of the estimated moments depends on the size of the sample and the variability of the data. As the sample size increases, the estimated moments become more accurate, and the variability of the data is reduced. However, in some cases, the sample may not be representative of the population, leading to biased or inaccurate estimates.
Estimating moments is an important tool in statistics and data analysis, and it is used in a variety of applications such as machine learning, signal processing, and finance. It allows us to gain insights into the underlying properties of a distribution, which can be used to make informed decisions and predictions.
OR
(a) Define NO SQL Database.
A NoSQL (not only SQL) database is a non-relational database that provides a mechanism for storage and retrieval of data that is modeled in means other than the tabular relations used in relational databases. NoSQL databases are designed to handle large volumes of unstructured, semi-structured, and structured data, and they can scale horizontally across many commodity servers to provide high availability and fault tolerance.
Unlike traditional relational databases, NoSQL databases do not use fixed schemas or table structures. They allow data to be stored in a flexible and dynamic way, using a variety of data models such as document, key-value, column-family, and graph models. This makes them well-suited for handling data that is rapidly changing or has complex relationships, such as social media feeds, sensor data, and user-generated content.
NoSQL databases are often used in big data and real-time applications where scalability, performance, and flexibility are important. They provide a flexible and scalable architecture that can handle large volumes of data, high traffic, and real-time queries. Some popular examples of NoSQL databases include MongoDB, Cassandra, Redis, Couchbase, and Apache HBase.
(b) What is Decaying Window Algorithm?
A decaying window algorithm is a method used in data stream processing and time series analysis to give more weight to recent data points while gradually reducing the weight of older data points over time. It is also known as a sliding window algorithm with exponential decay.
In this algorithm, a sliding window is used to process the data stream, with the size of the window remaining fixed over time. However, the contribution of each data point to the calculation of a metric or statistical measure gradually decreases as it moves further away from the current time. This is achieved by using an exponentially decaying weight factor that reduces the weight of older data points at a faster rate than more recent data points.
The decaying weight factor can be defined using a decay rate parameter that determines the rate at which the weights decay over time. The decay rate can be set to a value that reflects the importance of recent data compared to older data.
The decaying window algorithm is commonly used in applications such as real-time analytics, anomaly detection, and forecasting. It allows for the detection of changes in patterns and trends in the data stream over time, and can help to identify unusual or anomalous events that may require further investigation.
(c) Explain with a neat diagram about Stream data model and its
Architecture.
The stream data model is a way of representing and processing data that is continuously generated over time, such as sensor data, social media feeds, or financial transactions. In this model, data is processed as a continuous stream rather than as a set of discrete records.
The architecture of a stream data processing system typically consists of three main components: a data source, a stream processing engine, and a data sink. The data source generates a continuous stream of data that is fed into the stream processing engine, where it is processed and analyzed in real-time. The results of the processing are then sent to a data sink, such as a database or data warehouse, for further analysis or reporting.
The data source component of the system generates a continuous stream of data that is typically sent to the stream processing engine in real-time. This data can be generated by a variety of sources, including sensors, web logs, social media feeds, and other real-time data sources.
The stream processing engine is responsible for processing and analyzing the incoming data stream in real-time. It performs a series of operations on the data, such as filtering, aggregating, and transforming it, and then sends the results to the data sink. The processing engine may also perform complex event processing, which involves detecting patterns and correlations in the data stream and triggering actions or alerts based on those patterns.
The data sink component of the system is responsible for storing and analyzing the results of the stream processing. It can be a database, data warehouse, or other storage system that is capable of handling large volumes of data in real-time. The data sink may also provide tools for querying and analyzing the data, such as dashboards or reporting tools.
Overall, the stream data model and architecture provide a powerful framework for processing and analyzing large volumes of real-time data in a scalable and efficient manner. It is widely used in a variety of applications, including IoT, financial services, and social media analytics.
(a) Difference Between Hbase and Hive.
HBase and Hive are both data storage and processing technologies in the Hadoop ecosystem, but they have some key differences.
- Data Model: HBase is a NoSQL database that uses a column-family data model, where data is organized into columns and rows. It is optimized for real-time, random read/write access to large datasets. In contrast, Hive is a data warehousing tool that uses a relational data model, where data is organized into tables with rows and columns. It is optimized for querying and analyzing large datasets using SQL-like queries.
- Data Storage: HBase stores data in HDFS (Hadoop Distributed File System), while Hive can store data in HDFS, HBase, or other data sources such as Amazon S3.
- Data Processing: HBase is designed for real-time, low-latency data access and processing, while Hive is optimized for batch processing of large volumes of data.
- Data Access: HBase provides low-level APIs for accessing and manipulating data, while Hive provides a SQL-like interface for querying and analyzing data.
- Use Cases: HBase is commonly used for real-time data processing and analytics, such as fraud detection, log processing, and social media analytics. Hive is commonly used for batch processing and analytics, such as ETL (extract, transform, load) operations, data warehousing, and business intelligence reporting.
(b) Write a short note on Zookeeper.
ZooKeeper is an open-source, highly available, distributed coordination service used in large-scale distributed systems, including big data analytics systems. It provides a centralized service for maintaining configuration information, naming, synchronization, and group services.
In the context of big data analytics, ZooKeeper is often used for managing the distributed components of big data platforms such as Hadoop, Kafka, and Storm. For example, ZooKeeper can be used to manage the configuration information for Hadoop’s NameNode and DataNode, as well as for Kafka’s brokers and consumers.
ZooKeeper provides a simple and easy-to-use API for developers to build distributed systems, including a hierarchical namespace, watches, and data synchronization. It ensures high availability and reliability by providing fault tolerance and automatic recovery mechanisms.
(c) What does Real-Time Analytics Platform (RTAP) mean? Explain the
various applications of RTAP.
Real-Time Analytics Platform (RTAP) is a platform that enables organizations to collect, process, and analyze data in real-time, providing insights and making data-driven decisions in real-time.
RTAP applications are becoming increasingly popular across a wide range of industries, including finance, healthcare, retail, and manufacturing, among others. Some of the most common applications of RTAP include:
- Fraud Detection: RTAP can be used to detect fraudulent activities in real-time, such as credit card fraud or identity theft.
- Customer Engagement: RTAP can be used to personalize customer interactions and improve customer engagement in real-time, such as personalized product recommendations, real-time customer service, and chatbots.
- Predictive Maintenance: RTAP can be used to monitor industrial equipment and predict maintenance needs in real-time, reducing downtime and increasing operational efficiency.
- Supply Chain Optimization: RTAP can be used to monitor and optimize supply chain operations in real-time, such as inventory management and order fulfillment.
- Social Media Monitoring: RTAP can be used to monitor social media channels in real-time, providing insights into customer sentiment, brand reputation, and market trends.
OR
(a) Define features of Apache Spark.
Apache Spark is an open-source distributed computing system designed to process large-scale data in a distributed environment. Some of its key features are:
- Speed: Spark is designed to run programs up to 100x faster than Hadoop MapReduce in memory and up to 10x faster on disk.
- Ease of Use: Spark provides a simple and easy-to-use API for developers to build distributed applications in various programming languages such as Python, Java, Scala, and R.
- Flexible and Scalable: Spark is highly scalable and can handle data processing tasks ranging from gigabytes to petabytes of data, making it suitable for large-scale distributed systems.
- Fault Tolerant: Spark provides fault tolerance by tracking the lineage of data and automatically rebuilding lost data in the event of node failures.
- Real-time Stream Processing: Spark Streaming enables real-time stream processing and can process data from various sources such as Kafka, Flume, and Twitter, among others.
- Advanced Analytics: Spark provides a wide range of advanced analytics capabilities such as machine learning, graph processing, and SQL queries.
- Integration: Spark can be easily integrated with other big data technologies such as Hadoop, Hive, and HBase.
(b) Write a short note on Pig.
Apache Pig is a platform for analyzing large datasets that is built on top of Hadoop. It provides a high-level scripting language called Pig Latin, which allows developers to write data processing jobs using a SQL-like syntax. Pig can be used to handle structured, semi-structured, and unstructured data, making it a versatile tool for data processing.
Pig provides a number of built-in operators for performing common data processing tasks such as filtering, joining, grouping, and sorting. Pig also supports user-defined functions (UDFs), which allow developers to extend the functionality of Pig by writing custom code in Java, Python, or other languages.
One of the main advantages of Pig is its ability to handle complex data processing tasks in a single job. Pig supports a wide range of data sources including Hadoop Distributed File System (HDFS), Apache Cassandra, and Apache HBase, among others.
Another advantage of Pig is its ability to generate MapReduce code automatically. Pig translates Pig Latin scripts into MapReduce code behind the scenes, allowing developers to focus on the logic of their data processing tasks rather than the low-level details of MapReduce programming.
(c) Discuss about How E-Commerce is Using Big Data to Improve Business
in detail.
E-commerce companies are generating vast amounts of data every day, including customer behavior, product sales, and website traffic. Big data analytics can help these companies to extract valuable insights from this data to improve their business operations and increase sales.
One of the key ways that e-commerce companies are using big data is through personalized recommendations. By analyzing a customer’s browsing and purchase history, as well as their demographic information, e-commerce companies can recommend products that are most likely to appeal to them. This can improve the customer experience and increase the likelihood of a sale.
Another area where big data is being used in e-commerce is in inventory management. By analyzing sales data and customer demand, companies can optimize their inventory levels to ensure that they always have the right products in stock. This can help to reduce the risk of overstocking or stockouts, which can be costly for e-commerce businesses.
Big data analytics is also being used to improve marketing and advertising campaigns for e-commerce companies. By analyzing customer data, companies can better understand their target audience and create more effective marketing messages. They can also use data to target their advertising campaigns more effectively, reaching customers who are most likely to be interested in their products.
Finally, e-commerce companies are using big data to improve their website and mobile app experiences. By analyzing user behavior, companies can identify areas where the user experience can be improved, such as by making it easier to find products or checkout more quickly. They can also use data to test and optimize different website and app designs to improve customer engagement and increase sales.
“Do you have the answer to any of the questions provided on our website? If so, please let us know by providing the question number and your answer in the space provided below. We appreciate your contributions to helping other students succeed.”