Here, We provide Probability and Statistics GTU Paper Solution Winter 2021. Read the Full PS gtu paper solution given below.
PS GTU Old Paper Winter 2021 [Marks : 70] : Click Here
Question: 1
(a) Define a term random variable and explain different types of random variable.
A random variable is a function that maps the outcomes of a random experiment to numerical values. It is a way to assign a numerical value to the outcome of a random event. For example, the roll of a die is a random experiment, and the number that appears on the top face is the outcome. We can define a random variable X that maps the outcome of the roll of a die to a numerical value, such as X(1)=1, X(2)=2, X(3)=3, etc.
There are two main types of random variables:
- Discrete Random Variables: These are random variables that can take on a countable number of distinct values, such as the roll of a die.
- Continuous Random Variables: These are random variables that can take on any value within a given range. For example, the height of a person or the time it takes to run a certain distance are continuous random variables.
(b) A card is drawn at random from a pack of 52 cards. What is the probability
that the card is a spade or a king?
There are four suits in a standard pack of cards: spades, hearts, diamonds, and clubs.
Each suit has thirteen cards: ace, two, three, four, five, six, seven, eight, nine, ten, jack, queen, and king.
The probability of drawing a spade is 13/52.
The probability of drawing a king is 4/52.
P(Spade or King) = P(Spade) + P(King) = 13/52 + 4/52
So the probability of drawing a spade or a king is 17/52 or approximately 0.3269.
(c) State Baye’s theorem. There are three bags; first containing 1 white, 2 red and
3green balls; second 2 white, 3 red and 1green balls and third 3 white, 1 red
and 2 green balls. Two balls are drawn from a beg chosen at random. These
are found to be 1 white and 1 red. Find the probability that the balls so drawn
came from the second bag.
Baye’s theorem states that the conditional probability of an event A given that event B has occurred is equal to the product of the probability of event B given that event A has occurred and the probability of event A, divided by the probability of event B.
In this specific problem, we can set A as the event that the balls were drawn from the second bag, and B as the event that the balls drawn were 1 white and 1 red.
Using this information, we can calculate the probability that the balls were drawn from the second bag as:
P(A|B) = P(B|A) * P(A) / P(B)
where:
P(A) = probability of drawing from the second bag = 1/3 (since there are three bags and they are equally likely to be chosen)
P(B) = probability of drawing 1 white and 1 red ball = (2/5 * 3/4) / 3 = 2/10 P(B|A) = probability of drawing 1 white and 1 red ball given that the balls were drawn from the second bag = (2/5 * 3/4) = 3/10
Therefore, P(A|B) = (3/10 * 1/3) / (2/10) = 1/2
So the probability that the balls so drawn came from the second bag is 1/2
Question: 2
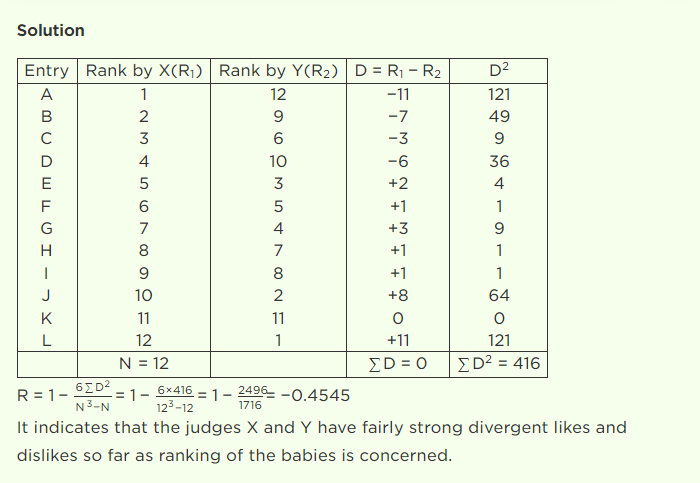
(a) Two judges in a beauty contest rank the 12 contestants as follows:
x 1 2 3 4 5 6 7 8 9 10 11 12
y 12 9 6 10 3 5 4 7 6 2 11 1
Calculate rank correlation coefficient.
(b) A book contains 100 misprints distributed randomly throughout its 100 pages.
What is the probability that a page observed at random contains at least 2
misprints.
Thesis contains 100 misprints distributed randomly throughout its 100 pages
In 100 pages 100 mistakes hence λ=1
probability that a page observed at random contains at least two misprints
= 1 – ( P(0) + P(1) )
P(X=x)= e^(−λ) * (λ)ˣ / x!
P(0) + P(1)
= e⁻¹ * 1⁰/0! + e⁻¹ * 1¹/1!
= e⁻¹ + e⁻¹
= 2e⁻¹
= 2/e
= 2 * 0.368
= 0.736
1 – ( P(0) + P(1) )
= 1 – 0.736
= 0.264
probability that a page observed at random contains at least two misprints = 0.264
(c) A die is thrown six times. If getting an odd number is a success, find the
probability of (i) 5 success (ii) at least five success and (iii) at most five
success.
The experiment is to toss the die 6 times. Getting an odd is considered a success.
6 tosses of the die are Bernoulli trial as they satisfy the conditions (i) finite number of trials, (ii) independent trials, (iii) there is a definite outcome and (iv) the probability of success does not change for each trial..
P (getting an odd number), p=63=21⟹q=1−p=1−21=21
Let X be the number of times we get an odd number, i.e. a successful outcome.Since X has a binomial distribution, the probability of x success in n-Bernoulli trials is
P(X=x)=nCx pxqn−x where x=0,1,……,n and q=1−p⟹P(X=x)=6Cx (21)x(21)6−x
(i) Probability of 5 successes =P(X=5)
⟹P(X=5)=6C5(21)5 (21)1=323
(ii) Probability of at least 5 successes P(X≥5)Given that there are only 6 tosses of the die.
⟹P(X≥5)=P(X=5)+P(X=6)P(X=6)=6C6(21)6 (21)0=641
∴P(X≥5)=323+641=647
(iii) Probability of atmost 5 successes
⟹P(X≤5)P(X≤5)=1−P(X>5)=1−647=6457
(c) If a random variable x is Gamma distribution with parameter λ = 3, compute
the value of (i) P(x≤1) and (ii) P(1≤x≤2).
Question: 3
(a) Calculate the coefficient of variance for the following data:
Class Interval : 0-10 10-20 20-30 30-40 40-50
Frequency : 5 7 2 3 3
| Class Interval | Midpoint | Frequency | (xi – mean)^2 | (xi – mean)^2 * fi |
|---|---|---|---|---|
| 0 – 10 | 5 | 5 | 36 | 180 |
| 10 – 20 | 15 | 7 | 16 | 112 |
| 20 – 30 | 25 | 2 | 16 | 32 |
| 30 – 40 | 35 | 3 | 16 | 48 |
| 40 – 50 | 45 | 3 | 16 | 48 |
Now, M (A.M) = ∑fx/∑f=420/20=25.7
Now, standard deviation (S.D) = 4.58
∴ Coeff of SD = SD/M = (4.58/21) = 0.2181
∴ Coeff of variation = Coeff of S.D × 100
= 0.2181 × 100 = 21.81%
(b) Calculate the median for the following data:
Class Interval: 0-30 30-60 60-90 90-120 120-150 150-180
Frequency 8 13 22 27 18 7
To find the median for this data set, we will need to use the cumulative frequency method.
| Class Interval | Frequency | Cumulative Frequency |
|---|---|---|
| 0-30 | 8 | 8 |
| 30-60 | 13 | 21 |
| 60-90 | 22 | 43 |
| 90-120 | 27 | 70 |
| 120-150 | 18 | 88 |
| 150-180 | 7 | 95 |
First, we will find the class interval where the cumulative frequency exceeds or is equal to half of the total frequency. In this case, the total frequency is 95, so half of that is 47.5. We can see that the cumulative frequency first exceeds 47.5 in the class interval of 90-120.
Next, we will use the formula:
Median = L + (n/2 – cf) / f * h
Where:
- L = lower limit of the median class
- n = total frequency
- cf = cumulative frequency of the class preceeding the median class
- f = frequency of the median class
- h = size of the class interval
Plugging in the values from our table, we get:
Median = 90 + (95/2 – 43) / 27 * 30 = 105
So the median for this data set is 105.
(c) Compute the correlation coefficients between X and Y using following data:
X 2 4 5 6 8 11
Y 18 12 10 8 7 5
To calculate the correlation coefficient between X and Y, we can use the following table to fill in the necessary values and find the total values:
| X | Y | X * Y | X^2 | Y^2 |
|---|---|---|---|---|
| 2 | 18 | 36 | 4 | 324 |
| 4 | 12 | 48 | 16 | 144 |
| 5 | 10 | 50 | 25 | 100 |
| 6 | 8 | 48 | 36 | 64 |
| 8 | 7 | 56 | 64 | 49 |
| 11 | 5 | 55 | 121 | 25 |
| 302 | 266 | 706 |
Now we can use the total values to calculate the correlation coefficient:
r = (n * Σ(xy) – Σ(x) * Σ(y)) / sqrt((n * Σ(x^2) – (Σ(x))^2) * (n * Σ(y^2) – (Σ(y))^2))
Where:
- n = 6 (number of pairs of data)
Plugging in the values:
r = (6302 – (2+4+5+6+8+11)(18+12+10+8+7+5)) / sqrt((6266 – (2+4+5+6+8+11)^2)(6706 – (18+12+10+8+7+5)^2)) r = (-86) / sqrt((-84)(-408))
r = -0.86
So the correlation coefficient between X and Y is -0.86, which indicates a strong negative correlation between the two variables.
Question: 3
(a) Obtain correlation coefficient between x and y if two regression lines are 4x-
5y+33=0 and 20x-9y-107=0.
To get mean values we must solve the given lines.
4X – 5Y = -33 … (1)
20X – 9Y = 107 … (2)
(1) × 5 ⇒ 20X – 25Y = -165
20X – 9Y = 107
Subtracting (1) and (2), -16Y = -272
Y = 272/16 272 16 = 17 = Y’
Using Y = 17 in (1)
we get, 4X – 85 = -33
4X = 85 – 33
4X = 52 X = 13 = X’
Mean values are X’ = 13, Y’ = 17,
Let regression line of Y on X be 4X – 5Y + 33 = 0
5Y = 4X + 33 Y = (4X + 33)

Y =  1/5 (4x + 33)

Y =  4/5 X + 33/5

Y = 4 /5 X + 33/5

Y = 0.8X + 6.6

∴ byx = 0.8
Let regression line of X on Y be
20X – 9Y – 107 = 0

20X = 9Y + 107

X = 1/20(9Y + 107)

X = 9/20 Y + 107/20

X = 0.45Y + 5.35

∴ bxy = 0.45
Coefficient of correlation between X and Y is
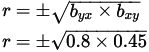
= ±0.6 = 0.6
(b) Calculate the mode for the following data:
Class Interval 0-10 10-20 20-30 30-40 40-50
Frequency 10 14 19 7 13
(c) Obtain the regression line of y on x for the following data:
x 100 98 78 85 110 93 80
y 85 90 70 72 95 81 74
Question: 4
(a) Explain the term related to testing of hypothesis: (i) Null hypothesis (ii)
Alternate hypothesis and (iii) Errors while accepting or rejecting a hypothesis.
(i) Null hypothesis (H0): It is the default assumption that there is no significant relationship between the variables being studied. It is a statement that there is no difference or no effect.
(ii) Alternate hypothesis (H1): It is the statement that is being tested against the null hypothesis. It represents the research hypothesis, which suggests that there is a difference or an effect. It is the opposite of the null hypothesis.
(iii) Errors while accepting or rejecting a hypothesis:
- Type I Error: It occurs when a null hypothesis is rejected when it is actually true. It is also known as a false positive or alpha error.
- Type II Error: It occurs when a null hypothesis is accepted when it is actually false. It is also known as a false negative or beta error.
(b) The mean of 35 sample of the thermal conductivity of a certain kind of cement
brick is 0.343 with standard deviation of 0.010. Test the hypothesis that the
population mean is 0.340 at 5% level of significance.
To test the hypothesis that the population mean is 0.340 at a 5% level of significance, we can use a one-sample t-test. The null hypothesis is that the population mean is equal to 0.340 (μ = 0.340), and the alternative hypothesis is that the population mean is not equal to 0.340 (μ ≠ 0.340).
Given the sample mean (x̄ = 0.343), sample size (n = 35), population standard deviation (σ = 0.010) and level of significance (α = 0.05), we can calculate the t-statistic as:
t = (x̄ – μ) / (σ / √n) = (0.343 – 0.340) / (0.010 / √35)
The t-value that is calculated can be compared to the critical value from the t-distribution table for a one-tailed test with 34 degrees of freedom (n-1) and a level of significance of 0.05. The critical value from the table is approximately 1.699.
Since the calculated t-value (0.301) is less than the critical value (1.699), we fail to reject the null hypothesis. This means that there is not enough evidence to suggest that the population mean is not equal to 0.340 at a 5% level of significance.
It’s important to note that, this test assumes that the population is normally distributed and the sample is random, independent and drawn from a large population.
(c) Fit a binomial distribution for the following data showing the survey of 800
families with 4 children and test the goodness of fit.
No. of boys 0 1 2 3 4
No. of girls 4 3 2 1 0
No. of families 32 178 290 238 64
Question: 4
(a) A random sample of size 15 from bivariate normal distribution gave a
correlation coefficient r=0.5. Is this indicate the existence of correlation in the
population?
(b) A tire company is suspicious to claim that the average lifetime of certain tires
is at least 28000 km. To check the claim, the company takes the sample of 40
tires and gets a mean life time of 27463 km with standard deviation of 1348
km. Test the hypothesis at 1% level of significance.
(c) Fit a Poisson distribution for the following data and test the goodness of fit.
x 0 1 2 3 4
f 112 73 30 4 1
Question: 5
(a) In y = a + bx if ∑ x = 50, ∑ y = 80, ∑ xy = 1030, ∑ x
2 = 750 and n =
10, then find a and b.
In a linear regression model, y = a + bx, the parameters a and b can be estimated using the method of least squares. The method of least squares finds the values of a and b that minimize the sum of the squared differences between the observed y values and the predicted y values (based on the estimated a and b values).
To find a and b, we can use the following formulas:
b = (n * ∑xy – ∑x * ∑y) / (n * ∑x^2 – (∑x)^2) a = (∑y – b * ∑x) / n
Plugging in the given values, we get:
b = (10 * 1030 – 50 * 80) / (10 * 750 – (50)^2) a = (80 – b * 50) / 10
b = 0.28 a = -5.6
Therefore, the estimated values of a and b are -5.6 and 0.28 respectively.Regenerate response
(b) Fit a curve y = aebx for the following data:
x 1 2 3 4
y 7 11 17 27
(c) State properties of the normal distribution. Suppose the marks of 800 students
are normally distributed with mean 66 and standard deviation 5. Find number
of students getting marks (i) between 65 and 70 (ii) greater than or equal to
72 (Given that P(0≤z≤0.20)=0.0793, that P(0≤z≤0.80)=0.2881 and that
P(0≤z≤1.2)=0.3849)
Question: 5
(a) A random variable x has the following probability distribution:
xi 0 1 2 3
pi 1/6 3/8 3/8 1/8
Find the standard deviation of x for the given distribution.
(b) With usual notations, find the value of p for a binomial random variable x
when n=6 and 9P(x=4)=P(x=2).

(c) Fit a parabola y = ax2 + bx + c for the following data:
x -1 0 1 2
y -2 1 2 4
Read More : DS GTU Paper Solution Winter 2021
Read More : DBMS GTU Paper Solution Winter 2020
“Do you have the answer to any of the questions provided on our website? If so, please let us know by providing the question number and your answer in the space provided below. We appreciate your contributions to helping other students succeed.”